September 1, 2026 | In
Your District’s Carbon Footprint Has a Number. Here’s How to Find It.
A step-by-step look at how ENERGY STAR® Portfolio Manager turns energy data into a GHG number

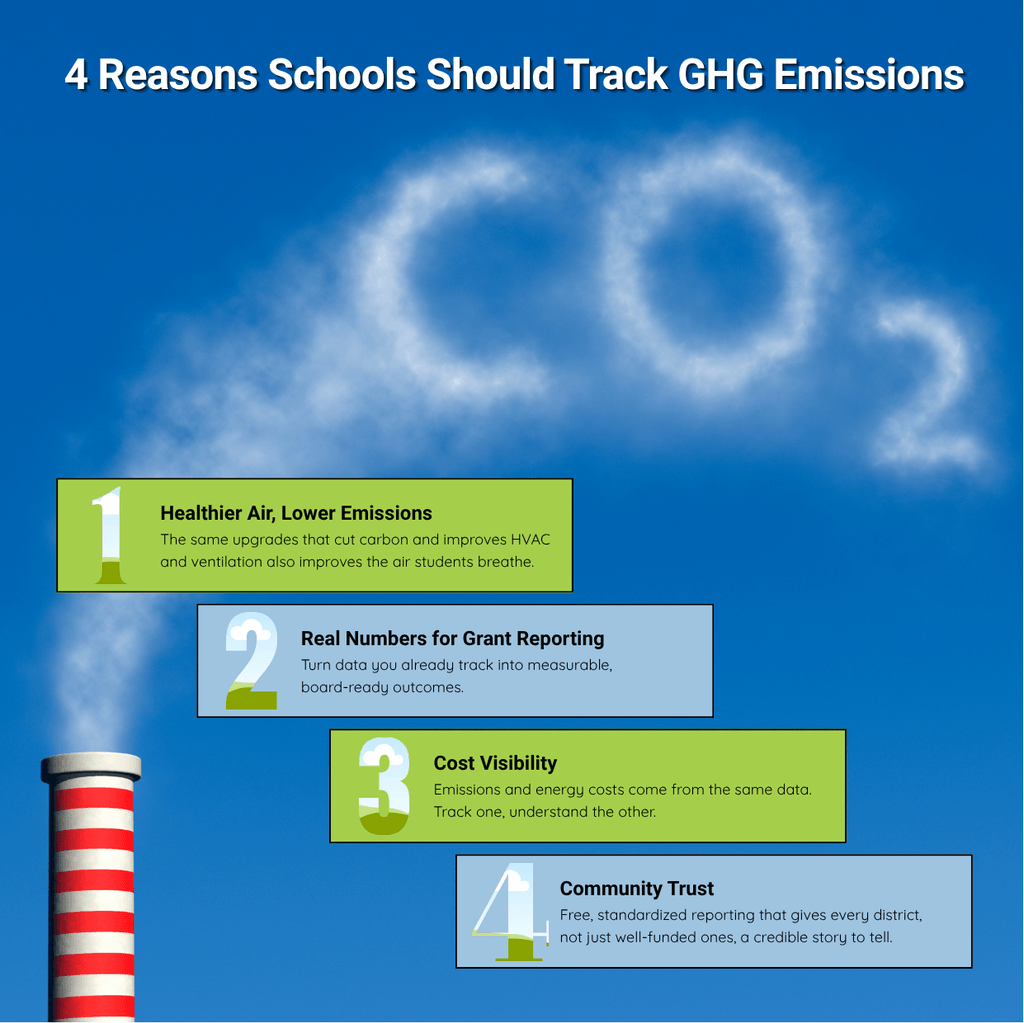
Every school district already tracks its energy costs closely, because utility bills come out of the same budget as everything else. Greenhouse gas emissions are the other side of that same bill, the part that doesn’t show up as a dollar figure but carries its own set of consequences: for the district’s EPA grant reporting, for the community’s trust that sustainability commitments are more than talk, and for the climate conditions students will be learning in for the next several decades.
The good news is that if your district is already benchmarking energy use, whether for an EPA IAQ grant, a board sustainability goal, or simple cost management, you likely already have what you need to calculate that number. The tool that does it, the EPA’s ENERGY STAR® Portfolio Manager, is one many districts are already using without realizing it also produces a greenhouse gas figure. This post walks through how, drawing on a recent EPA training, “Tracking Greenhouse Gas Emissions in Portfolio Manager,” presented by Andrew Schulte.

Why Buildings Are a Climate Priority
The case for paying attention starts with scale. Energy used by commercial buildings accounts for nearly 16% of total U.S. greenhouse gas emissions, according to the EPA, making building performance one of the highest-leverage places to act on climate goals. And the ENERGY STAR® program’s track record backs that up: EPA reports the program has helped avoid more than 4 billion metric tons of greenhouse gas emissions nationally, tied in large part to more than 5 trillion kilowatt-hours of electricity saved.
School facilities are squarely inside that opportunity. Every HVAC upgrade, every lighting retrofit, and every ventilation improvement your district makes for indoor air quality also shows up in its emissions profile, if you’re tracking it.
Two Kinds of Emissions, One Combined Number
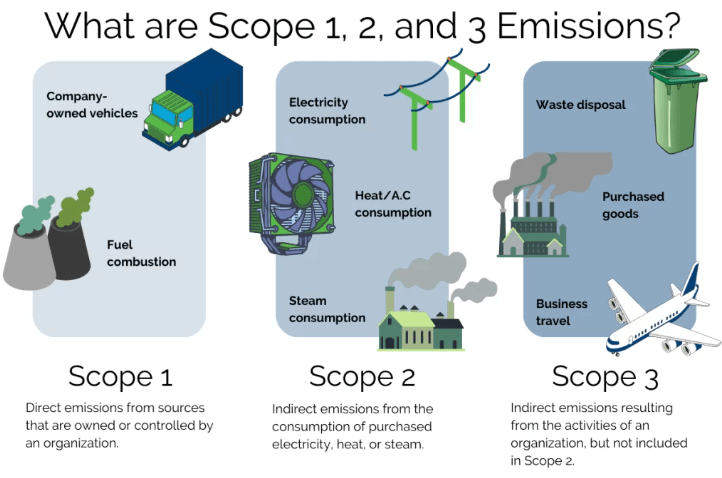
Portfolio Manager doesn’t ask you to track carbon dioxide, methane, and nitrous oxide separately. It rolls all three into a single carbon dioxide equivalent (CO2e) figure, calculated according to the Greenhouse Gas Protocol Corporate Accounting and Reporting Standard. Under that framework, your building’s footprint breaks into two categories:
Direct emissions (Scope 1):
These come from fuel your district burns on-site, such as natural gas, fuel oil, propane, or diesel used for heating and hot water. Portfolio Manager applies a single national emissions factor per fuel type. As one example, every MBtu of natural gas consumed corresponds to about 53.11 kilograms of CO2e.
Indirect emissions (Scopes 2 & 3):
These come from energy purchased from a utility, most commonly electricity, along with district steam or chilled water. Because someone else is doing the combustion, the emissions factor depends on where the generation happens, not where your building is. Portfolio Manager determines this using your building’s ZIP code, which maps to an EPA-defined eGRID sub-region with its own emissions rate.
One important caveat: Portfolio Manager doesn’t capture everything. Vehicle fleets, industrial processes, and refrigerant leaks from HVAC and air conditioning equipment fall outside its scope, even though they’re real contributors to a district’s overall footprint.

Where Green Power Fits In
If your district has invested in solar panels or purchases renewable energy, that decision shows up differently depending on the details. The determining factor is the renewable energy certificate, or REC, that’s generated alongside renewable electricity. Whoever holds the REC gets to claim the power as “green.”
On-site generation, RECs retained:
The portion of energy your buildings generate and consume on-site counts as zero emissions in your total footprint.
On-site generation, RECs sold:
If your district sells the RECs as part of a financing arrangement, even power your buildings physically use is treated the same as standard grid electricity for reporting purposes.
Off-site green power purchases:
Bundled renewable energy products from a utility or third-party supplier don’t reduce your total emissions figure directly. Instead, they show up in a separate “avoided emissions” metric that reflects their broader climate benefit.
That distinction matters for districts weighing renewable energy contracts or on-site solar: the accounting treatment isn’t automatic, and it depends on how the deal is structured.
Two Numbers That Don’t Always Move Together
It’s worth knowing that a building’s ENERGY STAR® score and its greenhouse gas emissions are related but distinct metrics. The score measures energy efficiency on a 1 to 100 scale. Emissions depend on that same efficiency plus the local electricity mix. Two schools with identical energy performance can post very different emissions totals simply because they sit in different eGRID sub-regions with different grid carbon intensity. Efficiency work still lowers emissions everywhere, but it isn’t the whole story.

From Data to Action: Getting the Numbers Out
Once your buildings are benchmarked, Portfolio Manager’s Reporting tab includes a pre-built Emissions Performance Report that requires no setup. Select your buildings and time frame, generate the report, and you’ll get direct emissions, indirect emissions, total emissions, avoided emissions from green power, your utility, your eGRID sub-region, and the applicable emissions rate, exportable to Excel or XML for board presentations or grant documentation.
EPA also offers a companion tool, the Building Emissions Calculator, which pulls data directly from Portfolio Manager and adds capabilities the standard reporting doesn’t: applying market-based or locality-specific emissions factors, and modeling forecast-year scenarios based on planned efficiency upgrades or shifts toward renewable energy. It’s a useful next step for districts ready to move from measuring past and current emissions to forecasting the impact of upcoming facility decisions.
Why This Matters for Equity-Focused Districts
Emissions tracking can sound like a resource-heavy exercise best suited to districts with dedicated sustainability staff. In practice, the opposite is often true: districts with the tightest budgets, including many serving high proportions of students on free or reduced-price lunch, stand to gain the most from a free, standardized tool that turns existing utility data into board-ready reporting, without hiring a consultant to do it.
Put It Into Practice
If your district has already started benchmarking in Portfolio Manager but hasn’t connected that data to a clear GHG picture, GGI’s course, Documenting GHG Emissions & Using ENERGY STAR® Portfolio Manager, walks through exactly this process step by step, tailored to school facilities. It’s a natural next stop after this training: the webinar explains how the methodology works, and the course helps your team apply it to your own buildings.
Ready to see where your district stands?
Explore the free course:
Documenting GHG Emissions & Using ENERGY STAR® Portfolio Manager
Visit the GGI IAQ hub for more tools and resources:
The Go Green Initiative – Healthier air, healthier schools, and healthier futures. Learn more at:
GoGreenInitiative.org/IAQ | IAQ@GoGreenInitiative.org
Upload IAQ Management Plan | EPA’s IAQ Tools for Schools & ENERGY STAR® Webinars
(This post draws on EPA’s ENERGY STAR® webinar series, “Tracking Greenhouse Gas Emissions in Portfolio Manager,” presented by Andrew Schulte.)